Pagalba
 Kontaktai
 Atsiliepimai
 Verslui
 Varlė


Krepšelis tuščias
Turite Varlės paskyrą?
Prisijunkite, kad pamatytumėte krepšelio turinį
Prisijungti

 Visos prekės


 Krepšelis
Tuščias
Prekių
Krepšelis
Prisijunkite, kad pamatytumėte krepšelio turinį
Prisijungti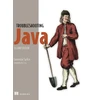
 4.6

 4.6
Ši prekė

 KNYGA Margo Jefferson On Michael Jackson
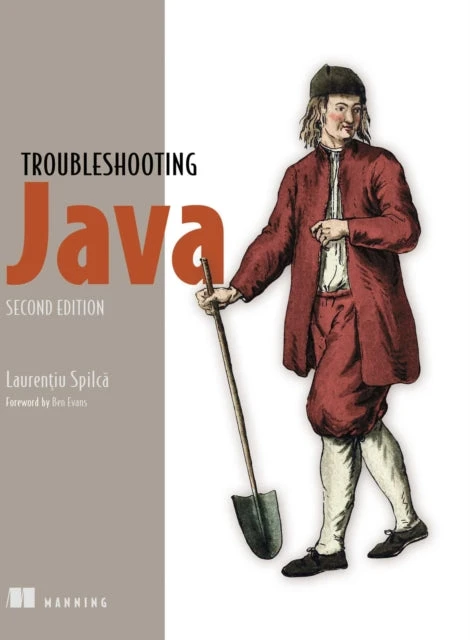
Learn how to quickly work out what your Java code is doing so you can understand when and why it misbehaves.Searching for bugs, detangling messy legacy code, or evaluating your codebase for new features sucks up much of a developer's time. Effectively reading and understanding existing code is a true superpower! Troubleshooting Java, Second Edition teaches you to efficiently analyze and debug Java applications using time-tested tools and new AI-powered techniques.In Troubleshooting Java, Second Edition you’ll learn: Efficiently use debuggers to quickly understand complex code Utilize AI-driven tools to automate log analysis, trace execution, and predict problems Correctly implement and interpret application logs Identify performance bottlenecks and optimize slow execution paths Profile SQL queries to diagnose and optimize database interactions Evaluate heap dumps to detect and fix memory leaks Analyze thread dumps to resolve deadlocks and concurrency issues Navigate the intricacies of service-oriented and microservices systems In Troubleshooting Java, Second Edition Java veteran Laurentiu Spilca shares techniques for reading, profiling, debugging, and optimizing Java code that he’s honed over years working with high-stakes systems. This fully-revised second edition, updates coverage for new Java tools and adds methods for saving time and effort using AI. You’ll master techniques to identify memory leaks, optimize database queries, and resolve threading issues with ease. The code samples are in Java, but the skills you learn in this guide can be applied to any JVM language.About the technologyWhether you’re working with legacy systems or using AI to generate fresh programs, you’ll spend more time reading and fixing code than writing it from scratch. Troubleshooting is a messy art, and efficient profiling, logging, debugging, and optimization will save you hours of time and countless headaches.About the bookTroubleshooting Java, Second Edition teaches practical techniques to diagnose, debug, and optimize Java applications. You’ll learn to uncover hidden dependencies, diagnose crashes, and resolve performance issues using tools like IntelliJ IDEA Debugger, VisualVM, and Heap Dump Analyzer. This revised and updated second edition introduces AI-powered troubleshooting tools, along with techniques for modern Java and cloud-native apps.What's inside Use debuggers to quickly understand complex code Automate code analysis with AI tools Implement and interpret application logs Identify performance bottlenecks About the readerFor intermediate Java developers.About the authorLaurentiu Spilca is a skilled Java and Spring developer and an experienced technology instructor. He is the author of Spring Start Here and Spring Security in Action.Table of ContentsPart 11 Starting to know your apps2 Understanding your app’s logic through debugging techniques3 Finding problem root causes using advanced debugging techniques4 Making the most of logs: Auditing an app’s behaviorPart 25 Identifying resource consumption problems using profiling techniques6 Finding hidden problems using profiling techniques7 Investigating locks in multithreaded architectures8 Investigating deadlocks with thread dumpsPart 39 Profiling memory-related problems10 Investigating memory problems with heap dumps11 Analyzing potential JVM problems with GC logsPart 412 Uncovering system-level failures and service communicationproblems13 Measuring data consistency and transactionsA Tools you’ll needB Opening a projectC Recommended further readingD Understanding Java threadsE Memory management in Java apps

 5-10 d. d.
 5-10 d. d.
 5-10 d. d.
 5-10 d. d.
 5-10 d. d.
 5-10 d. d.


 Atsiėmimas Venipak paštomate lapkričio 30 d.